Lithium-ion batteries are used in portable electronics, vehicles, and stationary energy-storage systems, creating a continuing need for practical ways to assess their condition. A useful diagnostic should provide more information than a simple voltage check while avoiding the time required for a complete charge-discharge capacity test.
Internal resistance is one common measurement. It can be measured with an alternating-current (AC) signal or by applying a direct-current (DC) load, but the results are not interchangeable because each method observes the cell over a different time scale. Modern cell designs, electrolyte formulations, additives, and electrode structures can also keep measured resistance relatively low over much of a battery’s service life. Resistance alone therefore does not provide a complete state-of-health assessment.
Several methods are used to obtain a more informative picture. Time-domain tests examine how a cell responds to a brief disturbance, while frequency-domain methods examine impedance over a range of frequencies. Both methods are sensitive to operating conditions and require calibration against cells of known chemistry, design, temperature, state of charge, and aging history.
Electrochemical Dynamic Response Testing
Electrochemical dynamic response is a time-domain approach that evaluates how a battery behaves after a brief electrical disturbance. A tester may apply a short load pulse or a similar change in operating conditions, then record the immediate voltage response and the subsequent recovery. The measured response is compared with reference parameters by an algorithm to estimate the condition of the cell.
The response is sometimes described in terms of an attack and recovery. A stronger cell generally shows a smaller disturbance under the same test conditions and returns toward its previous operating point more quickly. A weaker or more degraded cell may show a larger voltage change and a slower recovery. This behavior can contain information about internal resistance, polarization, charge-transfer processes, and transport limitations.
The result should not be interpreted as a direct measurement of ion mobility alone. Temperature, state of charge (SOC), recent charging or discharging, cell construction, contact resistance, and the applied pulse all influence the response. A reliable system must either control these variables or compensate for them in its model.
Commercial systems have used proprietary versions of this approach. QuickSort, associated with Cadex in the supplied source material, is described as using brief load pulses and reference parameters to classify lithium-ion packs. Such a product-specific method should not be treated as equivalent to a universally standardized test. Its accuracy depends on the trained model, the battery population used for calibration, and the operating range for which the model was developed.
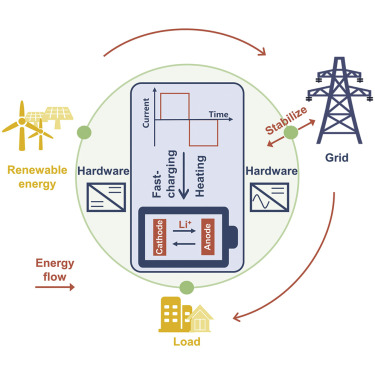
Source: Battery University

How Cell Chemistry and Pack Design Affect Test Calibration
Lithium-ion cells do not all have the same electrochemical response. Electrode materials, particle structure, separator, electrolyte, additives, current collectors, cell geometry, and manufacturing process can change both the fast electrical response and the slower diffusion behavior. Two cells with similar nominal voltage and capacity can therefore produce different diagnostic signatures.
Lithium-polymer cells commonly use a gel or polymer-containing electrolyte and may also use pouch construction. The label does not identify a single electrode chemistry, so the response cannot be generalized from the name alone. The supplied source describes gel-electrolyte lithium-polymer cells as having a faster dynamic response than the comparison class of conventional liquid-electrolyte lithium-ion cells and notes that modified calibration parameters may be required. That observation should be treated as a design-specific calibration issue rather than a universal rule for every lithium-polymer cell.
Proprietary active materials and additives create another source of variation. Manufacturers may not disclose all formulation details, and small changes can affect interfacial resistance, solid-electrolyte interphase behavior, polarization, and diffusion. A reference model trained on one manufacturer or cell format may therefore produce biased results when applied to another population.
Testing one small cell is also simpler than testing a series-parallel battery pack. A single cell has fewer electrical paths and usually fewer sources of imbalance. A pack may include:
- multiple cells with different aging histories;
- series resistance from tabs, busbars, fuses, and connectors;
- parallel-current sharing effects;
- cell imbalance and balancing activity;
- a battery-management system that changes the electrical state during the test; and
- thermal gradients between cells or modules.
A single-cell result should not automatically be transferred to a larger pack. Pack-level testing requires calibration for the number and arrangement of cells, pack impedance, protection electronics, accessible terminals, and the operating state of the complete assembly. A useful diagnostic should specify the supported cell size, pack configuration, SOC range, temperature range, and aging conditions rather than implying universal applicability.
Frequency-Domain Analysis: Resistance, Charge Transfer, and Diffusion
Frequency-domain testing applies a small AC perturbation and measures the resulting voltage or current response over a range of frequencies. Electrochemical impedance spectroscopy (EIS) is the best-known form. The battery is treated as an electrical system whose response changes as the excitation frequency changes.
The frequency regions are useful because different physical processes dominate at different time scales. However, the boundaries are not fixed. They vary with chemistry, cell size, electrode design, temperature, SOC, signal amplitude, wiring, and test fixture. A practical interpretation is:
- High frequency: predominantly ohmic or series behavior, including contributions from electrolyte, separator, current collectors, contacts, and other resistive elements.
- Middle frequency: interfacial charge-transfer and reaction kinetics, often represented with charge-transfer resistance and double-layer capacitance in an equivalent circuit.
- Low frequency: slower polarization and mass-transport or diffusion behavior, including lithium-ion movement within electrode materials.
These regions should not be treated as isolated physical compartments. Equivalent-circuit elements are models, not direct photographs of individual battery processes. Contact effects, surface films, porous-electrode behavior, and overlapping time constants can contribute to the same part of a scan.
Capacity fade may occur alongside increased charge-transfer resistance and slower apparent diffusion, but neither feature identifies one degradation mechanism by itself. Capacity loss can involve loss of lithium inventory, loss of active material, impedance growth, structural changes, or combinations of these processes. EIS is therefore most informative when combined with capacity testing, cycling data, differential analysis, or other diagnostic evidence.
Test Duration and the Challenge of Low-Frequency Measurements
The main practical limitation of frequency-domain testing is the time required to observe slow processes. A sinusoidal signal at 1 millihertz has a nominal period of 1,000 seconds, or approximately 16.7 minutes. A valid measurement may require multiple cycles at a frequency, and a complete sweep contains multiple frequency points. The total test can therefore become much longer than the duration of one nominal cycle.
This creates a direct trade-off between diagnostic resolution and test speed. Laboratory EIS can extend into very low frequencies when the objective is detailed characterization. A service or production tester, by contrast, may need to return a result in seconds or a few minutes. Such a tester cannot usually measure every low-frequency point directly.
Software can shorten the test by fitting an equivalent circuit, using a reference library, or estimating the slower response from higher-frequency or time-domain measurements. The model may also use battery identification, temperature, SOC, and previous operating data. These approaches can be useful, but the unmeasured behavior is inferred rather than directly observed. Accuracy depends on whether the tested battery resembles the population used to build and validate the model.
A five-minute test is best understood as a product-design target or practical operating objective, not a universal industry requirement. The required duration depends on the diagnostic purpose, cell size, chemistry, pack configuration, acceptable uncertainty, and frequency range. A model that works for a small mobile-device cell may not retain the same accuracy for a high-capacity traction or stationary-storage pack.
Interpreting Frequency Scans and Managing Uncertainty
A frequency scan may show the largest difference between healthy and aged cells in only part of the spectrum. In some cell populations, low-frequency bands reveal changes that are not obvious in the high-frequency resistance. In others, interfacial or contact effects dominate. The informative region must be established experimentally for the target battery population.
Impedance values alone are not a complete state-of-health measurement. SOC can alter electrode equilibrium and reaction kinetics, while temperature can strongly change electrolyte conductivity and charge-transfer resistance. A cold but healthy battery can therefore resemble a more resistive aged battery if conditions are not controlled.
Good test practice should record or control at least:
- cell or pack temperature;
- SOC and recent charge or discharge history;
- excitation amplitude and current range;
- rest time before the measurement;
- test leads, contacts, and fixture configuration;
- cell manufacturer, format, and chemistry; and
- aging pathway, including calendar storage or cycling history.
Calendar aging and accelerated laboratory aging may produce different signatures because the dominant degradation mechanisms and stress conditions differ. A model trained only on aggressively cycled cells may not predict naturally aged cells reliably. Reproducibility can also be affected by instrument bandwidth, calibration, wiring inductance, contact pressure, and the number of cells tested.
For these reasons, a diagnostic result should include uncertainty or confidence information where possible. A pass or fail decision made near a threshold requires more caution than a broad classification of clearly healthy and clearly degraded cells.
Reading a Nyquist Plot
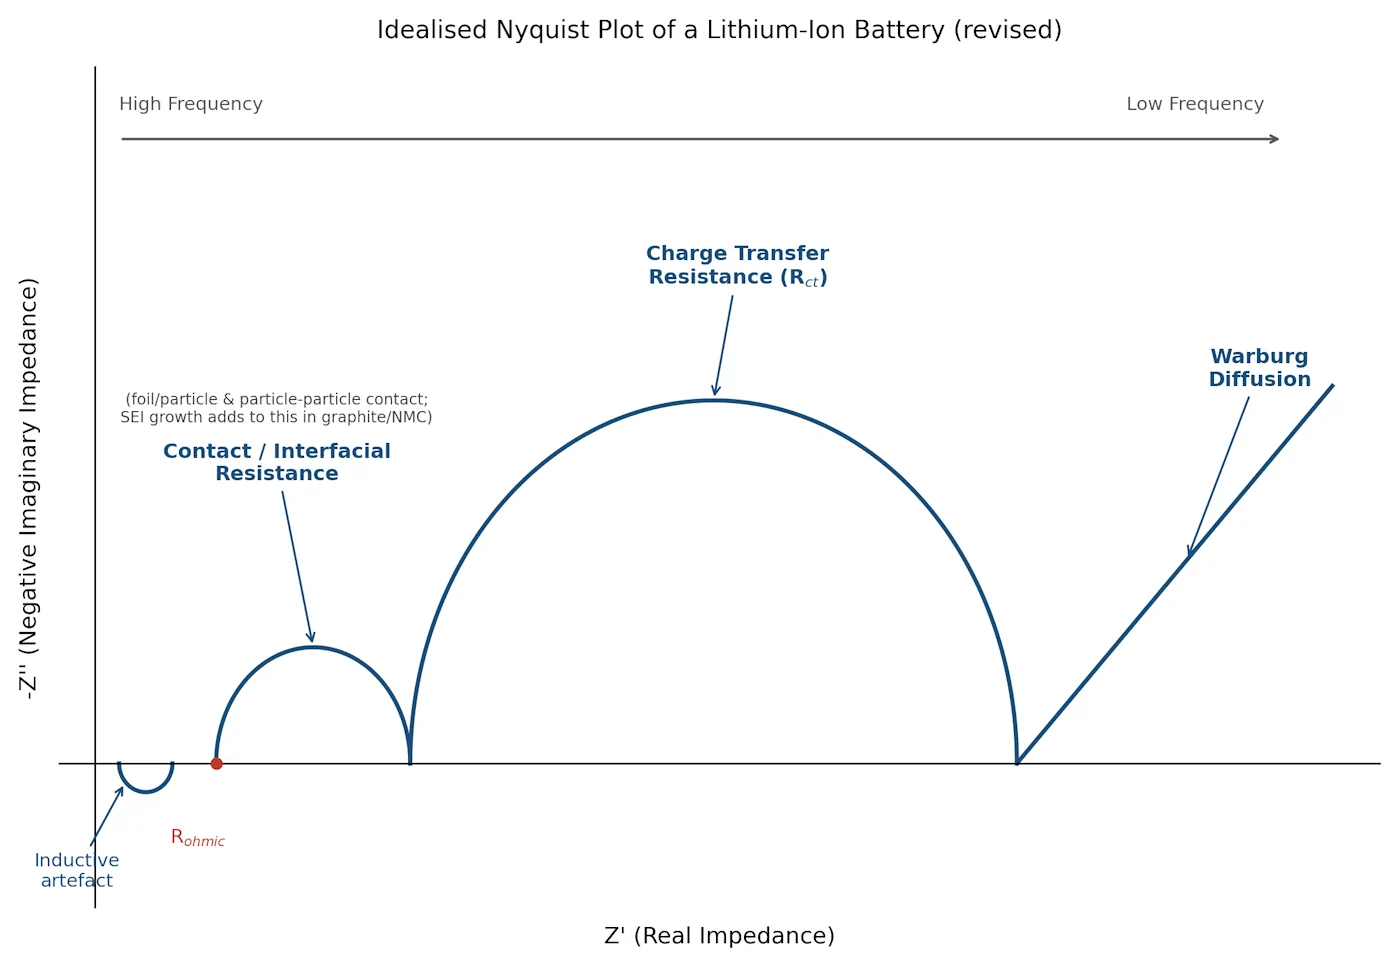
A Nyquist plot is a common way to display complex impedance. The real component of impedance is plotted on the horizontal axis, and the imaginary component is plotted on the vertical axis. Some conventions plot negative imaginary impedance upward; others place the negative values downward. The sign convention should always be stated before interpreting the shape.
The high-frequency end commonly approaches an intercept on the real axis. This region is associated mainly with series or ohmic resistance, although wiring and contact resistance can also contribute. A larger intercept may indicate increased resistance, but it does not identify whether the cause is the electrolyte, contacts, current collectors, surface films, or another series element.
A middle-frequency arc is often modeled with charge-transfer resistance in parallel with double-layer capacitance. It reflects interfacial reaction kinetics, but the arc can also contain contributions from porous electrodes, surface films, contact effects, and multiple overlapping processes. It should not be interpreted as a one-to-one measurement of charge-transfer resistance without an appropriate equivalent-circuit model.
The low-frequency portion often appears as a sloping tail associated with diffusion or mass transport. Its angle and shape depend on electrode structure, diffusion conditions, SOC, temperature, and the frequency range reached. Larger cells and packs can have longer characteristic time constants, so lower frequencies may be needed to observe comparable behavior.
The middle-frequency arc can be useful for comparing cells when the test conditions and population are controlled, but it is not universally the most informative region. The relevant diagnostic feature depends on the cell architecture, degradation mode, and purpose of the test.
Source: Battery University

Practical Rapid Testing and Related Battery Measurement Methods
A practical rapid test must balance the information gained from slow processes against the time required to measure them. A short pulse test may be suitable for screening when a calibrated reference model is available. EIS can provide a richer electrochemical signature, but direct low-frequency sampling may be too slow for routine service or production use.
Software estimation is one way to make frequency-based diagnostics faster. The tester can measure a limited frequency range or a transient response, then use curve fitting and a validated model to estimate parameters associated with slower behavior. This approach should be verified against direct measurements and full capacity tests across the intended range of temperatures, SOC, chemistries, and aging states.
Some battery analyzers use related concepts for both lithium-ion and lead-acid batteries, including comparisons of AC and DC resistance or model-based interpretation of electrical response. Similar measurement principles do not mean that the chemistries can be tested identically. Lead-acid batteries have different electrochemical reactions, construction, charge behavior, and failure modes. A lead-acid capacity-testing method cannot be assumed to measure lithium-ion capacity accurately without chemistry-specific validation.
A commercial instrument may measure capacity directly through a controlled charge-discharge cycle, estimate it from a calibrated diagnostic signal, or infer it from resistance and dynamic response. These are different claims and should be distinguished in specifications. A rapid result is generally an estimate unless the test includes enough controlled energy throughput to determine delivered ampere-hours directly.
Key Findings, Accuracy Limits, and Battery-Management Integration
No rapid test captures every symptom of battery failure. Cells can contain unusual defects, intermittent connections, safety-device faults, or degradation mechanisms outside the model’s training data. Outliers can therefore produce false acceptance or false rejection even when the average classification accuracy is good.
The supplied source presents correctly classifying roughly nine out of ten batteries as a practical target and reports that QuickSort exceeded this requirement for many single-cell mobile-phone packs. This is a source-reported benchmark, not a universal performance guarantee. Accuracy should be stated for a defined cell population, test condition, decision threshold, and validation set.
The same source describes a scope limited to single-cell mobile-phone packs up to 1,500 mAh and suggests that larger lithium-ion packs may require measurements lasting a few minutes to capture lower-frequency behavior. Those figures should be treated as product-specific and time-dependent rather than as general limits for all current rapid-test systems.
Capacity remains one of the most useful indicators of battery health because it describes how much charge the battery can deliver under specified conditions. It is not interchangeable with resistance, power capability, safety condition, or every other state-of-health metric. A cell can retain reasonable capacity while showing increased resistance, or show acceptable resistance during one test while having reduced usable capacity.
Rapid capacity estimation could support battery-management systems by providing an additional health indicator between full reference-capacity tests. It could also support service tools or charger-based screening. For example, a charger might approve a battery above a defined capacity threshold and flag one below it for further inspection.
Such automation requires safeguards. The system should account for temperature and SOC, confirm that the battery is electrically compatible, detect abnormal voltage or thermal behavior, and distinguish a diagnostic failure from a safety fault. Thresholds need calibration margins to limit false rejection, while uncertainty should prevent a marginal estimate from being treated as a definitive safety decision. A rapid diagnostic should supplement, not replace, the battery-management system’s voltage, current, temperature, insulation, and protection functions.
The most defensible testing strategy is therefore a layered one: use rapid dynamic or impedance measurements for screening, validate the model against controlled capacity and cycling data, and apply chemistry- and pack-specific limits before using the result in maintenance, quality control, or charger decisions.
References
- Battery University | BU-907: Testing Lithium-based Batteries. (n.d.). http://www.batteryuniversity.com/article/bu-907-testing-lithium-based-batteries
- Dynamic EIS Testing For Lithium Battery Diagnostics. (n.d.). https://iestbattery.com/dynamic-eis-testing-method-advantages-applications
- Lithium-ion batteries | IEEE Technology Navigator. (n.d.). https://technav.ieee.org/topic/lithium-ion-batteries
- How do you test the health of a lithium-ion battery? | EL-CELL. (n.d.). https://www.el-cell.com/how-do-you-test-the-health-of-a-lithium-ion-battery
- Battery Power Online | Battery Rapid-Test Methods. (n.d.). https://www.batterypoweronline.com/articles/battery-rapid-test-methods
- Lithium Ion VS Lithium Polymer batteries. (n.d.). https://www.grepow.com/blog/lithium-ion-vs-lithium-polymer-batteries.html
- Battery Degradation: Mechanisms, Causes, and How to Slow It. (n.d.). https://www.wevolver.com/article/battery-degradation-mechanisms-causes-and-how-to-slow-it
- Dynamic Battery Usage and its Effect on Degradation. (n.d.). https://research.chalmers.se/publication/546602/file/546602_Fulltext.pdf
- Battery state of charge estimation based on reduced order .... (n.d.). https://patents.google.com/patent/US9834112B2/en
- Lithium ion battery degradation: what you need to know. (n.d.). https://www.researchgate.net/publication/350281602_Lithium_ion_battery_degradation_what_you_need_to_know