Battery testing is an estimation problem rather than a direct measurement of one universal condition value. A tester observes electrical and electrochemical symptoms—such as voltage response, impedance, current, and charge behavior—and uses those observations to estimate state of health (SoH), usable capacity, power capability, or state of charge (SoC).
The same battery can produce different test results depending on its SoC, temperature, load, vibration or agitation, storage history, and age. A healthy battery at low charge may therefore resemble a degraded battery that is fully charged. Reliable diagnostics must separate these operating-condition effects from actual degradation. Modern approaches combine controlled measurements with mathematical models, statistical analysis, and machine-learning algorithms.
The methods below represent complementary approaches. Some are fast and practical but provide only indirect indicators; others can expose more detailed electrochemical behavior but require controlled conditions, reference data, and careful calibration.
Pulse Testing and Dynamic Electrochemical Response
A pulse test applies a controlled electrical load or current for a defined period and observes the resulting voltage change. A common calculation is the change in voltage divided by the change in current, producing an estimate of internal resistance:
[ R_i \approx \frac{\Delta V}{\Delta I} ]
The result is not a single battery constant. Pulse duration, pulse magnitude, depth of discharge, temperature, and rest conditions all influence the measured response. Short pulses can emphasize ohmic and connection resistance, while longer pulses may include polarization and electrochemical processes. Comparing responses at different pulse durations and discharge levels can reveal characteristics associated with a particular chemistry or battery model.
Internal resistance is useful for evaluating power delivery and detecting changes in a battery, but it does not reliably predict remaining capacity across all batteries and chemistries. Two batteries can have similar resistance and different usable capacities, or different resistance values without a directly proportional difference in capacity. Resistance-based results should therefore be interpreted against a characterized reference population or battery model.
Dynamic Electrochemical Response (DER) is a related approach for examining ion flow and dynamic lithium-ion behavior associated with battery health. Rather than treating a pulse result as a universal health score, DER uses the response profile to compare the battery with a model-specific characterization. This can provide information about dynamic behavior and degradation-related changes, but repeatability depends on chemistry, operating conditions, instrumentation, and the quality of the reference profile.
Pulse and dynamic-response testing are consequently most useful when the test protocol is consistent. A result obtained at one temperature, SoC, and pulse duration should not automatically be compared with a result obtained under different conditions.
Multi-Model Electrochemical Impedance Spectroscopy
Electrochemical impedance spectroscopy (EIS) applies a small alternating voltage or current signal to a battery over a range of frequencies and measures the response. The measured amplitude and phase shift describe the battery’s complex impedance. Different frequency regions can reflect different electrical and electrochemical processes, including ohmic resistance, charge-transfer behavior, interfacial effects, and ion transport.
A typical EIS workflow may include:
- applying a sinusoidal signal at multiple frequencies;
- filtering the measured response and extracting magnitude and phase;
- plotting the real and imaginary impedance components, often as a Nyquist plot;
- fitting an equivalent circuit or another mathematical model; and
- comparing extracted parameters with reference data from batteries of the same type at different health states.
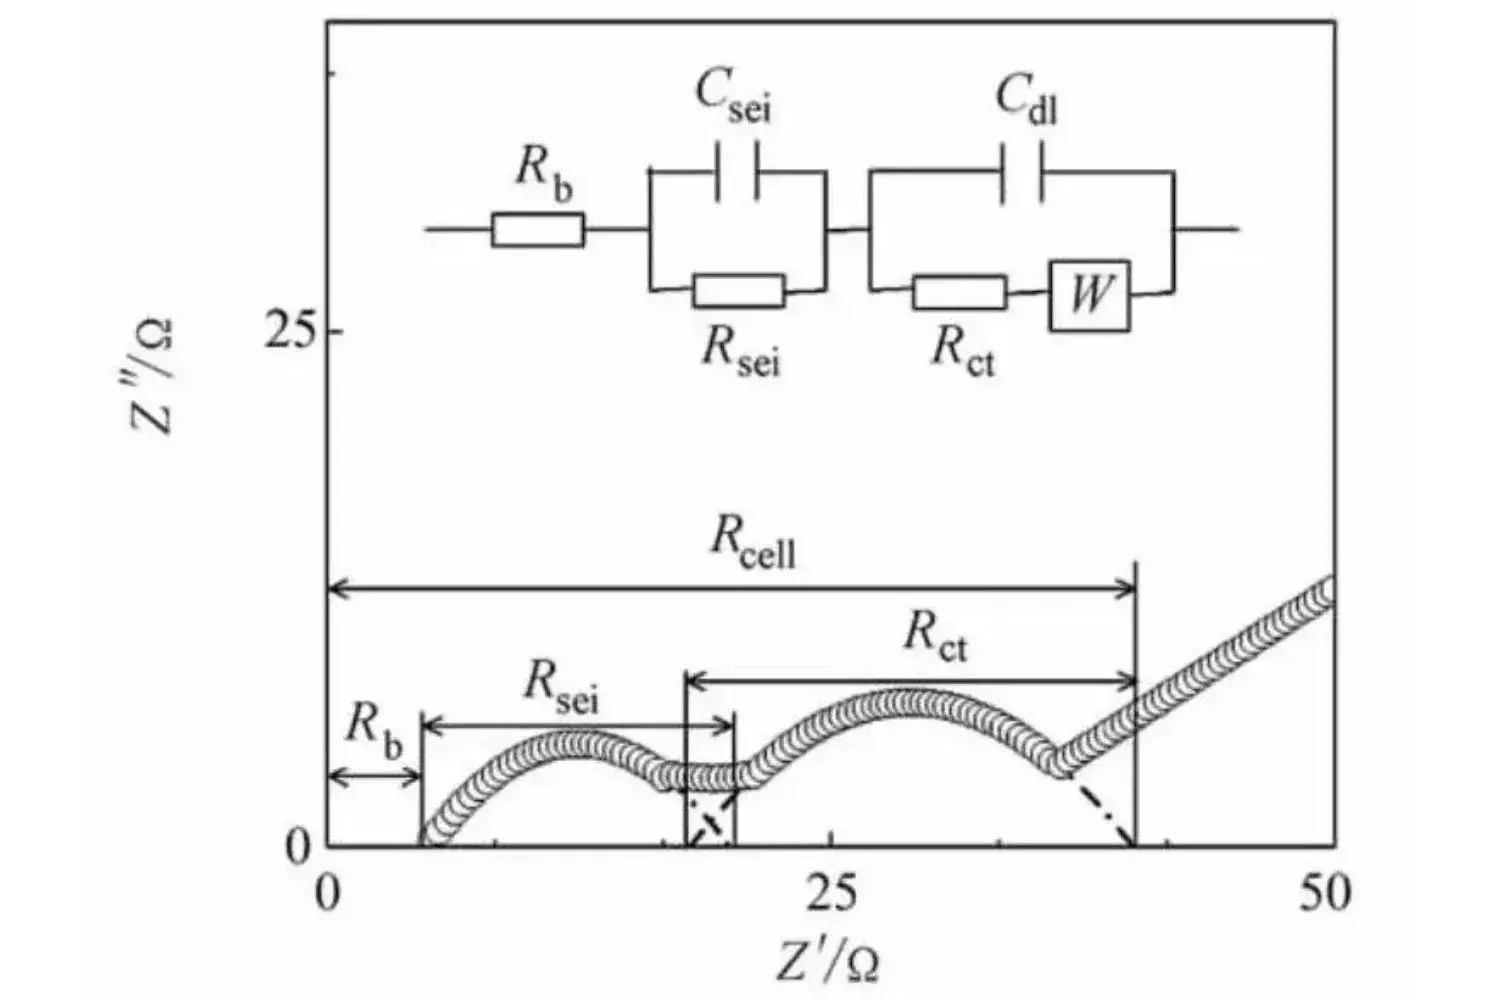
Source: Battery University
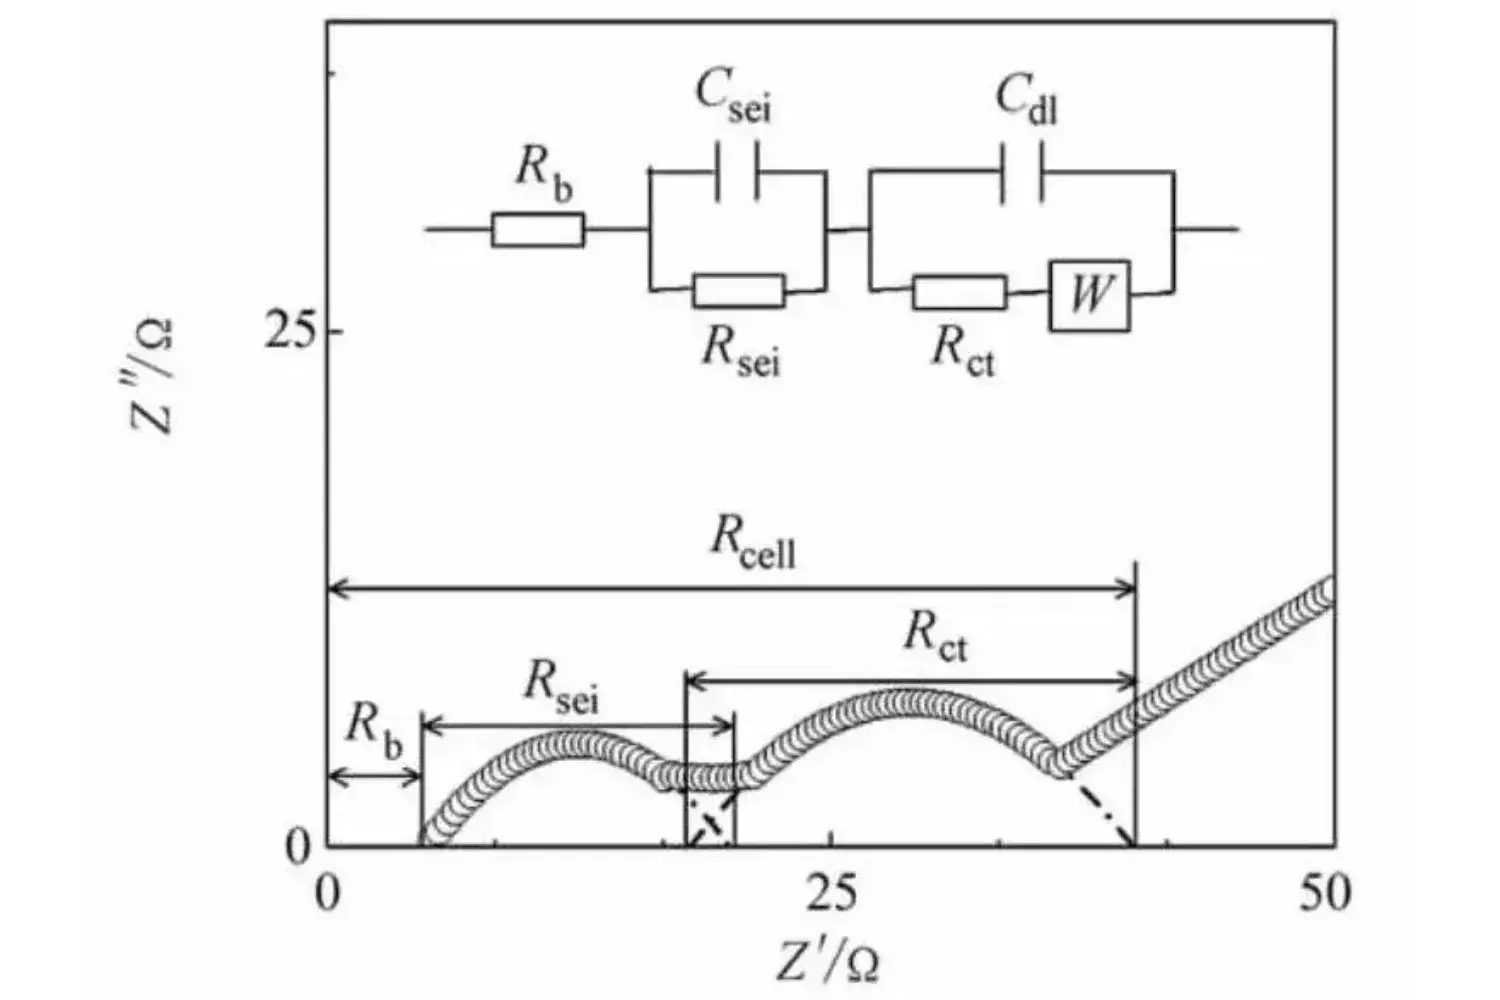
EIS can be combined with statistical models or machine-learning methods. Data fusion may correlate impedance features with capacity, cold-cranking performance, SoC, power capability, or other diagnostic indicators. The method is attractive because it can probe several aspects of battery behavior without relying only on one DC resistance value.
However, EIS is not automatically chemistry-independent or condition-independent. Its interpretation depends on battery chemistry, voltage range, capacity, temperature, SoC, excitation level, measurement quality, and model calibration. An equivalent circuit that describes one cell design may not describe another. Pack-level measurements also include connections, wiring, balancing circuits, and differences between cells.
Frequency limits, resistance thresholds, supported voltage and capacity ranges, and commercial instrument capabilities are device-specific specifications rather than universal requirements. A reported threshold or accuracy should be accepted only in the context of the instrument, battery population, test protocol, and validation method that produced it. EIS is a promising diagnostic technique, but its value depends on controlled measurement and an appropriate interpretation model.
Fuzzy-Logic Battery Health Estimation
Fuzzy logic provides a way to process uncertain or imprecise diagnostic information. Instead of assigning an input only to a sharp category such as “low” or “high,” a measured parameter can belong to several fuzzy sets with different degrees of membership.
For battery diagnostics, inputs might include impedance features, voltage response, temperature, estimated SoC, or pulse-derived resistance. Membership functions convert these measurements into fuzzy variables. A rule base or rule matrix then expresses relationships such as the following conceptual pattern:
- if resistance is high and usable voltage response is weak, the estimated health is low;
- if resistance is moderate and the response is stable, the estimated health is intermediate; and
- if several indicators remain within the reference range, the estimated health is high.
The fuzzy inference process combines these partially applicable rules. Defuzzification then converts the resulting fuzzy output into a usable value, category, or diagnostic score. This can be helpful when the boundaries between healthy and degraded behavior are not precise or when expert knowledge is available but a complete physical model is difficult to construct.
Fuzzy logic still depends on the quality of its inputs and rules. Poorly selected membership functions can produce misleading results, and rules developed for one chemistry or application may not transfer to another. It may also be replaced by another algorithm when a different method performs better for the available data, especially if the dataset is small, noisy, or poorly labeled.
Artificial Neural Networks for Battery Diagnostics
An artificial neural network (ANN) learns a relationship between input measurements and an output. In battery applications, inputs can include voltage, current, temperature, impedance features, charge history, operating conditions, and usage variables. The output may be a classified health condition or a continuous estimate such as SoH or remaining capacity.
An ANN is organized into layers containing interconnected neurons. Its behavior is influenced by the number and arrangement of layers, the number of neurons, activation functions, optimizer, learning rate, batch and training settings, and number of training epochs. These are model-design and training factors, not universal battery-test constants.
The training data must represent the intended application. Measurements should be accurately labeled, and the dataset should include the relevant range of temperatures, SoC values, loads, aging conditions, and battery-to-battery variation. If user behavior or operating patterns affect degradation, those patterns should be represented when they are relevant to the model’s intended use.
A network can fit its training data well while producing poor predictions on new batteries. Overfitting, inadequate calibration, limited explainability, sensor errors, and domain shift are important risks. Domain shift occurs when deployment conditions differ from the conditions represented during training—for example, when a model trained on one cell design or temperature range is applied to another.
ANN-based diagnostics should therefore be evaluated with data kept separate from the training set and with metrics appropriate to the intended decision. A model that performs well in a laboratory dataset may still require recalibration before use in a different pack, vehicle, climate, or duty cycle.
Gaussian Process Regression for State-of-Health Prediction
Gaussian process regression (GPR) is a probabilistic modeling method that represents a distribution of possible functions relating measured battery parameters to an output such as SoH. Rather than returning only one estimate, a GPR model can also provide an indication of prediction uncertainty under its assumptions.
This probabilistic structure can make GPR useful when datasets are smaller than those often used for neural-network training. It can model nonlinear relationships while retaining information about uncertainty, provided that the selected covariance function, input features, and noise assumptions are appropriate.
GPR is not automatically superior to an ANN, fuzzy-logic system, or another algorithm. Reported performance depends on the battery chemistry, cell population, health range, sample size, test protocol, feature selection, and evaluation metric. A result described as “accurate” may refer to a particular error threshold or test population and should not be generalized without those details.
A practical comparison should consider more than the average prediction error:
| Method | Useful characteristic | Important limitation |
|---|---|---|
| Fuzzy logic | Represents uncertain inputs with interpretable rules | Requires suitable membership functions and rules |
| ANN | Learns complex relationships from representative data | Can overfit and may be difficult to interpret |
| GPR | Provides probabilistic predictions and can work with smaller datasets | Performance depends strongly on model assumptions and reference data |
| EIS with model fitting | Uses frequency-dependent electrochemical information | Requires controlled measurement and suitable calibration |
| Adaptive filtering | Tracks changing state during operation | Requires a suitable battery model and accurate measurements |
Research reports may describe particular accuracy levels, remaining-capacity thresholds, or large battery-population comparisons. Such figures are not universal performance guarantees. Their meaning depends on battery age distribution, chemistry, sample size, test conditions, pass/fail definition, and independent validation. The broader engineering goal is to build robust models that need fewer representative sample batteries without sacrificing reliability across the intended operating range.
Adaptive Filtering, Coulomb Counting, and Low-State-of-Charge Diagnostics
An adaptive filter estimates a battery’s hidden state from measured inputs and a battery model. An extended Kalman filter (EKF), for example, can estimate SoC while updating that estimate from voltage and current measurements. At the same time, coulomb counting tracks charge entering or leaving the battery by integrating current over time:
[ \Delta Q = \int I(t),dt ]
In practice, coulomb counting is affected by current-sensor error, integration drift, uncertain efficiency, and an uncertain initial SoC. The filter uses the battery model and measured voltage to correct the running estimate. The quality of the result depends on whether the model represents the cell or pack over the relevant temperature, current, and aging range.
Usable capacity can be estimated by combining the tracked change in SoC with the energy or charge added during a controlled charging process. A sufficiently deep discharge before the test can make the observed charging interval more informative, because a narrow or poorly defined operating window may not reveal the battery’s full usable range.
The battery model, cell population, pack design, sensors, and control system may require calibration or characterization. In some systems, a one-time characterization cycle is performed for a battery model or pack; in others, parameters are updated during operation. The correct procedure is design-specific.
Proposed charge-window rules, including charging from a particular percentage of SoC to full charge, should be treated as test claims requiring validation rather than universal rules. The suitable window depends on chemistry, temperature, charging behavior, cell balance, battery age, and the accuracy required by the application.
Combining EIS with Kalman filtering is another possible strategy. EIS can provide frequency-dependent information about internal electrochemical condition, while the filter tracks changing SoC and operating state. This combination may improve interpretation when a battery is tested at low SoC, where a single voltage or resistance measurement can be ambiguous. It still requires validation against known battery conditions and does not guarantee a universal improvement.
Low-SoC diagnostics may be relevant to screening applications such as vehicle warranty assessment, where a repeatable estimate of usable condition could help identify batteries requiring further inspection. Any claimed reduction in warranty cost or improvement in screening must be demonstrated for the specific vehicles, packs, operating conditions, and decision thresholds involved.
References
- Battery University | BU-907b: Advancements in Battery Testing. (n.d.). http://www.batteryuniversity.com/article/bu-907b-advancements-in-battery-testing
- Diagnosis of Lithium-Ion Batteries State-of-Health based .... (n.d.). https://vbn.aau.dk/ws/files/234560477/Diagnosis_of_Lithium_Ion_Batteries_SOH_based_on_EIS_technique.pdf
- lithium-ion battery state of health estimation using. (n.d.). https://lutpub.lut.fi/bitstream/10024/170103/3/Mastersthesis_Ivanov_Yury.pdf
- Testing Battery with EIS. (n.d.). https://www.large-battery.com/blog/testing-battery-with-eis-early-fault-detection-and-analysis
- EIS Testing For Battery Failure Analysis: A Complete Guide. (n.d.). https://iestbattery.com/case/diagnosing-lithium-battery-failure-with-eis
- Advanced Electrochemical Impedance Spectroscopy (EIS) for Battery Testing PDF Asset Page | Keysight. (n.d.). https://www.keysight.com/us/en/assets/3121-1209/white-papers/Advanced-Electrochemical-Impedance-Spectroscopy-EIS-for-Battery-Testing.pdf
- Modeling and Applications of Electrochemical Impedance .... (n.d.). https://www.jecst.org/upload/pdf/jecst-2019-00528.pdf
- A new state-of-health estimation method for lithium-ion .... (n.d.). https://www.researchgate.net/publication/321466651_A_new_state-of-health_estimation_method_for_lithium-ion_batteries_through_the_intrinsic_relationship_between_ohmic_internal_resistance_and_capacity
- Multi-Model EIS - Cadex Electronics. (n.d.). http://www.cadex.com/resources/technology-research/multi-model-eis
- BU-915: Testing Battery with EIS. (n.d.). http://www.batteryuniversity.com/article/bu-915-testing-battery-with-eis